Madeline Wimmer, Extension Educator, Fruit Crops
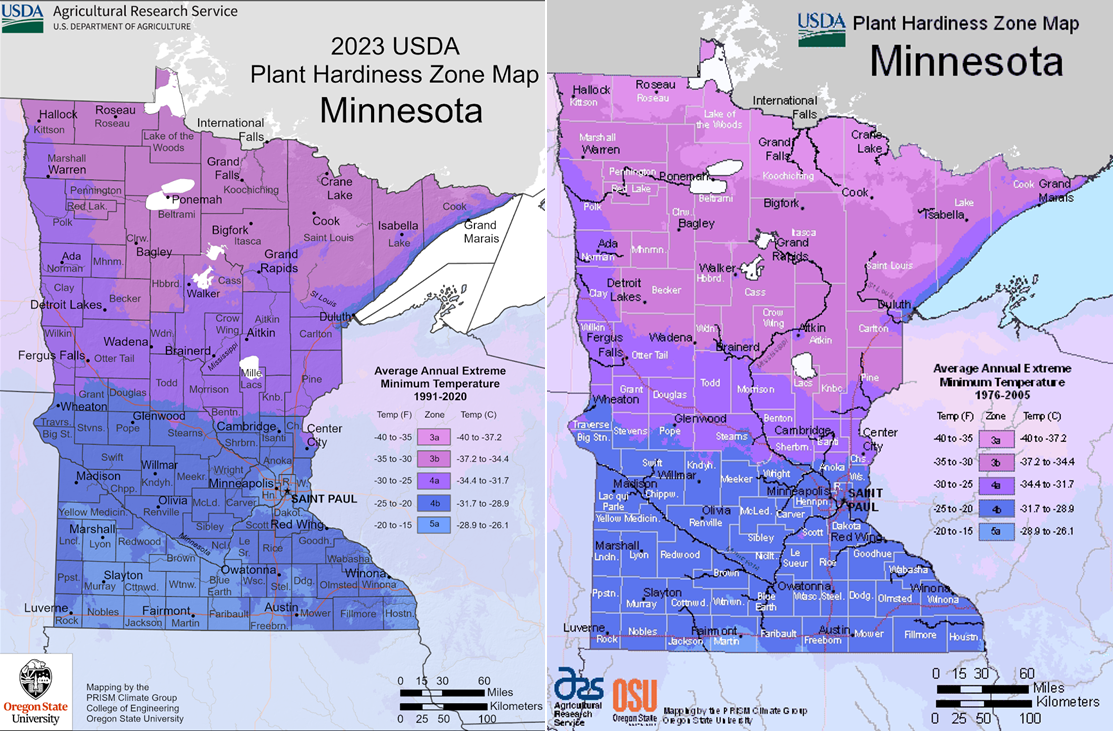
Images: The new 2023 USDA Plant Hardiness Zone Map for Minnesota (left) and previous from 2012 (right).
The United States Department of Agriculture (USDA) plant hardiness zone map is a tool based on average annual extreme winter temperatures that can help growers determine which plants can survive the winter and thrive in a given region. Zones are represented by a number scale from 1-13, separated by 10°F increments, with larger numbers being warmer than smaller numbers. Each zone is then divided into two half zones, ‘a’ and ‘b’, with ‘a’ having 5°F colder average extreme winter temperatures than ‘b’.
Both plant species and cultivars (i.e., cultivated variety) vary in zone hardiness. For example the wine grape cultivar ‘Petite Pearl’ is listed by the Minnesota Department of Agriculture (MDA) to be hardy in Zone 4 regions, whereas ‘Concord’ should be grown in Zone 5 or higher and will have lower chances of surviving in colder hardiness zones. The plant hardiness zones do not guarantee plant survivability, which is still influenced by overall weather variability, soil health, plant health, and management practices (e.g., pruning techniques, nutrition upkeep, water/irrigation inputs).
The USDA recently updated the zone maps for the first time since 2012. While some regions in Minnesota have remained the same as the old map, there are many areas that have bumped up a half zone from 4b to 5a in areas like Minneapolis, St. Paul, and Fairmont; from 4a to 4b in Glenwood and Cambridge, for example; or 3b to 4a and so on.
So what does this mean for Minnesota growers? The new maps do not indicate large shifts in zone hardiness for most regions to sway too far away from what’s typically grown, but some plants that were once marginally hardy may now have a higher chance of surviving. Keep in mind, as stated above, that plant winter survivability is a factor of more than just average extreme winter temperatures. Polar vortex anomalies and mid-winter warm temperatures followed by extreme cold also play a role. Additionally, plants that bear fruit that are overcropped or in poor health, may lack fitness and be prone to winter injury.
Growers should also take into consideration that insects and disease causing pathogens can also be influenced by shifts in hardiness zones. Warmer temperatures typically increase the ability for eggs and spores to overwinter and lead to problems the following year, or introduce new pests altogether that previously were not an issue in a particular region.
Which zone do you live in? Did it shift from 2012 to the 2023 map?
View the whole 2023 USDA Plant Hardiness Zone Map of the US.
Find out the hardiness of plants you’re interested in growing at the MDA Plant Hardiness List 2023.

Comments
Post a Comment